
 |
Honorable Mention – End Impunity Infographic United Nations Educational, Scientific and Cultural Organization (UNESCO) |
| Infographic: Raising Awareness to End Impunity |
|
|
|


| UNESCO: Raising Awareness to End Impunity Motion Graphics |
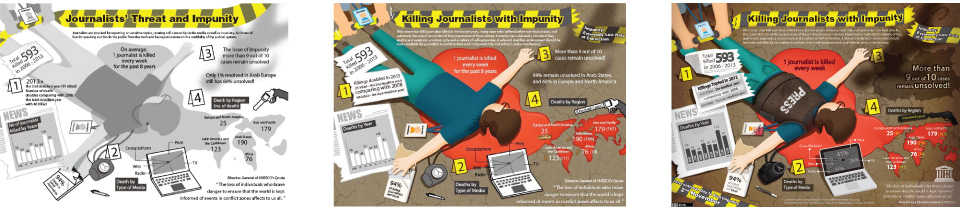
| In the past decade, on average one journalist is killed for reporting the news and bringing information to the public every week. In nine out of ten cases the killers go unpunished. UNESCO would like to raise public awareness about ending Impunity for crimes against Journalists. This motion graphics will give us an overview of impunity. |
 |
Content Strategy |
|
The data from UNESCO was reorganised into 4 major parts, and was illustrated and incorporated as evidences found in the crime scene. The readers become the investigators who examine the evidences and gradually learn about the issue of impunity.
To facilitate the discussion on impunity, 3 characters are illustrated to tell the visual story:
1) Dead journalist: as a key visual of the infographic to bring out the data of impunity and build up strong visual impact At last, the quote by the Director-General of UNESCO serves to round up the impact of impunity to everyone in the world. |
 |
Creative Process |
| In order to create an excellent work efficiently, both clients and our team have to work closely together at all stages. This Ending Impunity infographic serves as a great example of our creative process. |
| Stage 1: Scope and Content |
| To kick off the project and set its scope, client should provide all research, information or other data that would like to be included in the infographic. While our team is reviewing the content, client should also determine the followings: |
|
Objectives: purpose of the infographic – branding, marketing, explaining complex concept/info, training, etc. Timeline and distributions: deadline and other milestones? print / web / mobile / presentation PPT / social media Dimensions and orientations: portrait or landscape? any specific dimensions or constraints? Graphic style or color scheme: any corporate styling guidelines, preferred style, or any infographic you like from us or others |
| Stage 2: Creative and Sketch |
| Before we move on to graphic design, our team will develop and share a creative draft of the infographic which outlines the content structure and information included in the graphic. All changes to content and its structure should be made at this stage; or else, changes made while design is in progress would disrupt the project schedule and increase its scope. |
| Stage 3: Design and Final Delivery |
| Our design services include two revisions. Timely feedback at different phases of design will help keep project running smoothly. |
| Creative and Sketch | 1st and 2nd Draft | Final |
 |
| Sketch is to present the layout and graphic elements. At this stage, client should feedback on the layout, graphic elements, and information hierarchy. Once content structure is confirmed, we will move on to the 1st draft. | For the 1st draft, client should address display of information and any major changes to copy or data. As for the 2nd draft, client should provide final feedback on any copy changes and minor tweaks. Charges may apply for additional revisions. |
Upon final approval, we will deliver the final file in format of JPG for static infographic. Additional fee is needed for the provision of source files or other file formats. |
| In general, it takes around 3 to 4 weeks to create a single static infographic. If you are looking for an unique and appealing infographic, just contact us to learn more about our services. |
 |
Media Coverage |
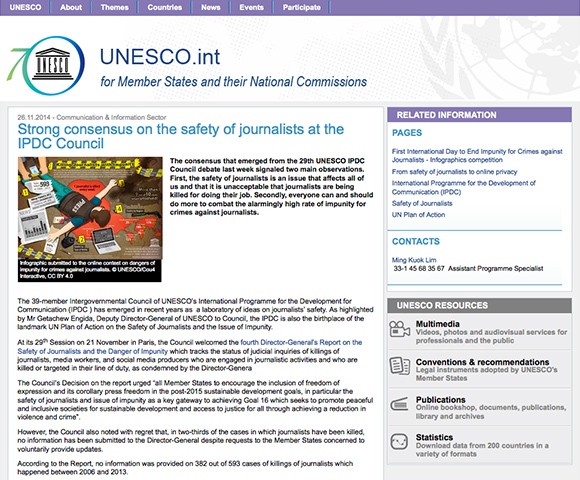 |
Our infographic has been selected to elaborate the high rate of impunity for crimes against journals in a news article by UNESCO. The article reports that a strong consensus on the safety of journalists has been reached at the IPCD Council that killing of journalists is unacceptable and affects us all and everything should do their best to fight against impunity for crimes against journalists.
This infographic and related articles have been used in press releases, presentations, and publications to attract the journalists and media to report on the issue and embed or reprint the infographic. |
 |
 |
Awards
 |
|
 |
|
 |
|
Featured Clients
 |
 |
 |
 |
 |
 |
 |
 |
Work with Us
 |